
Research - International Journal of Medical Research & Health Sciences ( 2021) Volume 10, Issue 2
Analysis of Filtering Approaches to Brain MRI in Spatial Domain
Vedant Shukla1*, Prasad Khandekar2 and Arti Khaparde12Department of Engineering and Technology, Dr. Vishwanath Karad MIT World Peace University, Pune, India
Vedant Shukla, School of Electronics and Communication Engineering, Dr. Vishwanath Karad MIT World Peace University, Pune, India, Email: vedshukla00@gmail.com
Received: 30-Dec-2020 Accepted Date: Feb 11, 2021 ; Published: 18-Feb-2021
Abstract
Non-linear filters are used to filter out the artifacts and noise present in MR data. The balance between signal preservation and noise reduction makes restoration of MR data a complex task. Application of non-linear filters such as median and Non-Local Means Filter (NLM) filter converts the right-skewed Rician Distribution into un-skewed Gaussian distribution. NLM filter gives better results than Bilateral and Median filter. As the distribution is un-skewed after the application of non-linear filters, standard linear filters such as Gaussian and Wiener filters were applied and results were drawn. A linear combination of NLM and Gaussian filter gives satisfactory results. The experimentation was performed on 40 clinical images and the NLM filter was found to have the best results. The image quality indices used for comparison are Peak Signal-to-Noise Ratio (PSNR), Root Mean Squared Error (RMSE), Structural Similarity Index (SSIM), and entropy. The experimentation was performed on MATLAB 2020a.
Keywords
Rician distribution, Bilateral filter, NLM filter, PSNR, RMSE, SSIM, Entropy
Introduction
MR signal is prone to signal-dependent Rician noise. Non-linear filters prove to be the most optimum model to filter such images. Since decades of research, several filters are applied and tested on MR Data. In 1986, Pitas I, et al. applied non-linear filters to multiple data, to understand the properties of noise present in the data [1]. In 2008, Fernendez SA, et al. developed Linear Minimum Mean Squared Error (LMMSE) filter for the restoration of MR brain images [2]. In 2015, Mohan J, et al. published a survey of MR data de-noising [3]. A fourth-order PDE is one non-linear filter that can be applied to MR data as suggested by Yu-Li, et al. [4].
In this article, multiple filtering approaches were discussed, such as linear and non-linear filtering, transform domain as well as statistical approach. A combination of linear and non-linear filters can also be implemented; one such approach is discussed by Meenakshy, et al. [5]. A bilateral filter is one non-linear filter that smoothens the images and preserves the edges as well. Chaudhary K, et al. from IISc Bangalore modified the standard bilateral filter to make it more accurate and fast [6]. Though trilateral filters are also developed, which an extended Bilateral filters by Chang H, et al. in 2018 [7]. In 2020, Chen KL, et al. proposed a novel filter that was a combination of Fuzzy c-means and Adaptive Non-Local Means [8].
The synthetic data on which the filtering models were performed are referred from the BrainWeb database [9]. National Library of Medicine, USA provides MR images for research and analysis, which were used in this research article [10]. Clinical Brain MR Images were obtained from BRATS 2012 database [11].
Background
MRI Data Noise Distribution
MR Data is mainly distorted due to thermal noise from the scanned object. Thermal noise is in turn caused due to electronic components, coil, etc. The raw data obtained is complex representing Fourier Transform, and inverse Fourier Transform needs to be computed. The magnitude image is thus non-linear and the PDF of such images changes. The Probability Distribution Function (PDF) of a Rician distributed image is expressed as:
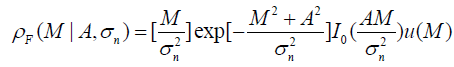
Here, I0 (∙) is the 0th order Bessel Function of the first kind and u (∙) is the Heaviside step function.
Application of Standard Non-linear Filters
Non-linear filters are applied to Rician distributed data. Some standard non-linear filters are the Bilateral filter, Median filter, and the Non-Local Means filter. Although the NLM filter should show better-filtering results, the distribution of the filtered image should be of importance. In Figure 1, the histogram of the Rician corrupted image and the median filtered image is shown. It can be observed that although the distribution in Rician corrupted image is Rician, the distribution of the median filtered image is Gaussian i.e. unskewed [7].
A similar change is observed in the distribution of in NLM filtered image as shown in Figure 1. Although the change in distribution occurs when input noise is high, hence it can be stated that the non-linear filters convert Rician intensity distributed data into Gaussian.

Figure 1: Histogram of median filtered data.
Application of Linear Filters to Gaussian Distributed Data
From the intensity plot of non-linear filtered image, it is evident that the distribution of image is Gaussian. For such distribution, linear filters such as Gaussian filter and Wiener filter can be applied. Linear filters are low-pass filters, i.e. they help in image smoothing. In frequency domain filtering, the homomorphic filter is one well-known filter for converting noise from signal-dependent to signal independent [12-17].
Experimental Results
The filters were applied on MR data including synthetic T1 weighted brain MRI and pelvis subset MRI as well as clinical brain MRI. The block diagram of the experimentation is demonstrated in Figure 2.

Figure 2: Research flow diagram.
Application of Non-linear Filters to Rician Distributed MR Images
The very general non-linear filters applied to MR data are Bilateral, Median, and Non-Local Means filters. In Table 1, we compare the filters using PSNR, RMSE, SSIM, and entropy.
| %N | s | PSNR 1 | PSNR 2 | PSNR 3 | PSNR 4 | SSIM 1 | SSIM 2 | SSIM 3 | SSIM 4 | RMSE 1 | RMSE 2 | RMSE 3 | RMSE 4 | Entropy 1 | Entropy 2 | Entropy 3 | Entropy 4 |
|---|---|---|---|---|---|---|---|---|---|---|---|---|---|---|---|---|---|
| 0.1 | 0.215 | 63.3644 | 64.1511 | 37.4921 | 60.4492 | 0.9995 | 0.9996 | 0.9858 | 0.9986 | 0.1731 | 0.1581 | 3.4036 | 0.2421 | 6.1327 | 6.1214 | 6.0695 | 6.0945 |
| 0.2 | 0.43 | 53.2829 | 53.3196 | 37.4249 | 52.2469 | 0.9906 | 0.9908 | 0.9769 | 0.9751 | 0.5526 | 0.5502 | 3.43 | 0.6226 | 6.2407 | 6.2408 | 6.2025 | 6.0453 |
| 0.5 | 1.075 | 46.3603 | 46.3627 | 37.1743 | 47.8376 | 0.9498 | 0.9498 | 0.947 | 0.9688 | 1.2261 | 1.2258 | 3.5304 | 1.0343 | 6.3641 | 6.3628 | 6.1804 | 6.0697 |
| 1 | 2.15 | 40.5025 | 40.5047 | 36.4027 | 41.29 | 0.8714 | 0.8715 | 0.8781 | 0.8711 | 2.4067 | 2.406 | 3.8584 | 2.1981 | 6.5638 | 6.5636 | 6.3244 | 6.0314 |
| 1.5 | 3.225 | 37.0647 | 37.0646 | 35.4395 | 38.3862 | 0.8145 | 0.8145 | 0.8307 | 0.8327 | 3.5752 | 3.5753 | 4.3109 | 3.0707 | 6.7046 | 6.7043 | 6.4508 | 6.0218 |
| 2 | 4.3 | 34.5535 | 34.5533 | 34.3491 | 36.176 | 0.793 | 0.8047 | 0.7803 | 0.7951 | 6.5376 | 5.3018 | 3.8672 | 5.9307 | 4.5342 | 6.2175 | 6.5457 | 6.3781 |
| 2.5 | 5.375 | 32.8331 | 34.8012 | 32.0372 | 33.8336 | 0.7716 | 0.7834 | 0.7599 | 0.7741 | 5.8195 | 5.6396 | 6.3779 | 5.1863 | 6.6137 | 6.2146 | 6.619 | 6.354 |
| 3 | 6.45 | 31.962 | 33.5621 | 31.3222 | 32.8648 | 0.7547 | 0.7696 | 0.7444 | 0.7606 | 6.4334 | 5.351 | 6.9252 | 5.7983 | 6.6629 | 6.1612 | 6.6606 | 6.2811 |
| 4 | 8.6 | 30.4385 | 31.4343 | 30.0362 | 30.9984 | 0.7294 | 0.7472 | 0.7221 | 0.738 | 7.6668 | 6.8364 | 8.0303 | 7.1882 | 6.7507 | 6.2916 | 6.7518 | 6.4188 |
| 5 | 10.75 | 28.9618 | 29.5547 | 28.7183 | 29.2664 | 0.7081 | 0.7278 | 0.7041 | 0.7179 | 9.0876 | 8.488 | 9.346 | 8.7744 | 6.8196 | 6.3177 | 6.8116 | 6.4328 |
| 10 | 21.5 | 23.7454 | 23.7196 | 23.8307 | 23.6817 | 0.6177 | 0.6424 | 0.6319 | 0.6351 | 16.568 | 16.6173 | 16.4061 | 16.69 | 7.0142 | 6.455 | 6.9762 | 6.5416 |
Table 1 :Image quality indices comparison.
In Table 1, PSNR of Rician corrupted and the original image is PSNR 1, bilateral filtered and the original image is PSNR 2, median filtered and the original image is PSNR 3 and that of NLM filtered and the original image is PSNR 4. Similar terminologies are used for RMSE, SSIM, and entropy. It can be noted that the NLM filter gives better results than the other non-linear filters.
In Figure 3, it can be observed that the Rician distribution upon application of non-linear filters tends to unskewed normal distribution. Since the distribution is now normal, we apply linear filters such as Gaussian and Wiener filters.

Figure 3: T1 weighted brain MR after applications of filters.
Linear Filters to Gaussian Distributed Data to Synthetic Brain MR Images
Linear filters such as Gaussian and Wiener filters are applied to non-linear filtered MR images. In Table 2, PSNR 5, PSNR 6, PSNR 7, PSNR 8 represent the Peak Signal to Noise Ratio (PSNR) of Gaussian filter applied to Median filtered image, Gaussian filter applied to NLM filtered image, Wiener filter applied to Median filtered image, Wiener filter applied to NLM filtered image concerning the original image. Other parameters such as SSIM, RMSE, and Entropy follow the same terminology. The corresponding filtered image can be seen in Figure 3e, Figure 3f, Figure 3g, and Figure 3h respectively. In Table 2, the combination of an application of Gaussian filter on NLM filter gives the best results. This can be observed in RMSE, SSIM, PSNR, and Entropy.
| %N | s | PSNR 5 | PSNR 6 | PSNR 7 | PSNR 8 | SSIM 5 | SSIM 6 | SSIM 7 | SSIM 8 | RMSE 5 | RMSE 6 | RMSE 7 | RMSE 8 | Entropy 5 | Entropy 6 | Entropy 7 | Entropy 8 |
|---|---|---|---|---|---|---|---|---|---|---|---|---|---|---|---|---|---|
| 0.1 | 0.215 | 35.8763 | 42.8023 | 34.3477 | 38.0867 | 0.9799 | 0.9946 | 0.9629 | 0.9777 | 4.0994 | 1.8468 | 4.8883 | 3.1784 | 6.1357 | 6.171 | 6.2003 | 6.2379 |
| 0.2 | 0.43 | 35.8287 | 42.5104 | 34.3162 | 38.0042 | 0.9704 | 0.9705 | 0.9527 | 0.9561 | 4.122 | 1.9099 | 4.9061 | 3.2087 | 6.2613 | 6.0846 | 6.3219 | 6.2169 |
| 0.5 | 1.075 | 35.6946 | 42.1252 | 34.1252 | 37.8693 | 0.943 | 0.9662 | 0.9284 | 0.9493 | 4.1861 | 1.9965 | 4.9626 | 3.2589 | 6.211 | 6.1227 | 6.1227 | 6.1884 |
| 1 | 2.15 | 35.1602 | 39.8923 | 33.8189 | 36.9798 | 0.8736 | 0.8712 | 0.8592 | 0.8585 | 4.4517 | 2.5818 | 5.1951 | 3.6103 | 6.3482 | 6.1004 | 6.3883 | 6.224 |
| 1.5 | 3.225 | 34.4765 | 38.12 | 33.306 | 36.0809 | 0.8261 | 0.8337 | 0.8125 | 0.8225 | 4.8163 | 3.1662 | 5.5111 | 4.0114 | 6.4609 | 6.0559 | 6.4784 | 6.2131 |
| 2 | 4.3 | 33.6423 | 36.3828 | 32.6686 | 35.0008 | 0.7935 | 0.8059 | 0.7811 | 0.7964 | 4.7738 | 4.7739 | 4.8875 | 3.9604 | 6.8174 | 6.8175 | 6.1701 | 6.6882 |
| 2.5 | 5.375 | 32.8558 | 32.5884 | 33.2467 | 34.4011 | 0.7336 | 0.7336 | 0.7727 | 0.7781 | 5.9857 | 5.9857 | 5.5489 | 4.8583 | 6.9116 | 6.9115 | 6.6166 | 6.2172 |
| 3 | 6.45 | 30.9699 | 30.9704 | 32.2764 | 33.0409 | 0.7012 | 0.7013 | 0.7549 | 0.7619 | 7.0119 | 7.2114 | 6.2047 | 5.6819 | 6.9921 | 6.992 | 6.6933 | 6.2075 |
| 4 | 8.6 | 28.5065 | 28.5063 | 30.5747 | 31.0216 | 0.6458 | 0.6457 | 0.7266 | 0.7393 | 9.5767 | 9.5769 | 7.5475 | 7.169 | 7.1051 | 7.105 | 6.7768 | 6.298 |
| 5 | 10.75 | 26.4889 | 26.489 | 28.9482 | 29.2535 | 0.5928 | 0.5927 | 0.7005 | 0.7185 | 12.0808 | 12.0806 | 9.1019 | 8.7875 | 7.1997 | 7.1998 | 6.8677 | 6.3353 |
| 10 | 21.5 | 20.5242 | 20.5241 | 23.726 | 23.8105 | 0.4006 | 0.4006 | 0.5949 | 0.6331 | 24.0066 | 24.0066 | 16.6051 | 16.4442 | 7.4355 | 7.4344 | 7.0517 | 6.4865 |
Table 2: Image Quality Indices Comparison
It should be noted that SSIM 6 in Table 2 shows better results than SSIM 4 in Table 1. Hence, it can be concluded that a linear combination of Linear Gaussian Filter and non-linear NLM filter gives the best results.
Application of Linear Combination of Gaussian and NLM Filter to Clinical MR Images
In the last subsection, it was concluded that a linear combination of non-linear NLM Filter and linear Gaussian filter gives best better results for synthetic MR images. This combination of filters is now applied to clinical images. As a demonstration, all the non-linear filters and combination is applied to the preliminary clinical image (Figure 4).

Figure 4: Clinical brain MR after applications of filters.
The study was performed on 40 clinical images. The Structural Similarity Index (SSIM) of randomly selected 10 images is tabulated in Table 3. The terminologies are the same as in Tables 1 and 2. It can be noted that similar observations can be seen on clinical images, as on synthetic images. Experimentation on clinical images is challenging because of the absence of ground truth. The non-linear NLM filter works best as compared to the Bilateral and Median filter, while a linear combination of NLM and Gaussian filter gives satisfactory results. This can be interpreted using SSIM values in Table 3 and visually analysed using the corresponding line plot as in Figure 5.
| # | SSIM 2 | SSIM 3 | SSIM 4 | SSIM 5 | SSIM 6 | SSIM 7 | SSIM 8 |
|---|---|---|---|---|---|---|---|
| 1 | 0.9232 | 0.9105 | 0.939 | 0.9031 | 0.9368 | 0.8707 | 0.8938 |
| 2 | 0.976 | 0.9293 | 0.992 | 0.9175 | 0.9799 | 0.9001 | 0.9384 |
| 3 | 0.9764 | 0.8529 | 0.9883 | 0.8436 | 0.976 | 0.8271 | 0.9319 |
| 4 | 0.9698 | 0.9545 | 0.9923 | 0.9465 | 0.9846 | 0.9401 | 0.9659 |
| 5 | 0.9784 | 0.9715 | 0.9996 | 0.9644 | 0.9948 | 0.9472 | 0.9725 |
| 6 | 0.9841 | 0.9201 | 0.9906 | 0.9032 | 0.9773 | 0.8795 | 0.9287 |
| 7 | 0.9776 | 0.9626 | 0.9974 | 0.956 | 0.9912 | 0.9427 | 0.9678 |
| 8 | 0.9904 | 0.9798 | 0.9992 | 0.9749 | 0.9957 | 0.9689 | 0.9854 |
| 9 | 0.9893 | 0.9684 | 0.9987 | 0.9622 | 0.9933 | 0.9493 | 0.9694 |
| 10 | 0.9752 | 0.9468 | 0.9877 | 0.9348 | 0.9785 | 0.9183 | 0.9493 |
Table 3 :Noise level vs. SSIM of filtered brain images

Figure 5:Structural similarity index of clinical MR Images concerning table 3.
Conclusion
Due to signal dependency of Rician noise, non-linear filtering is preferred. In this research work, standard non-linear filters such as Bilateral filter, Median filter, and NLM filters are applied to synthetic as well as clinical brain MR data. It is observed that the NLM filter works best when compared to other non-linear filters. It was also observed that upon application of non-linear filters, the distribution of the MR data tends to be Gaussian. Hence further experiments were performed by applying a linear combination of non-linear and linear filters and it was observed that NLM and Gaussian filter in series gives SSIM values closest to unity. But in the case of clinical MR images, the NLM filter gives the best results while the NLM-Gaussian filter gives acceptable results. This was validated by computing the standard image quality parameters.
Declarations
Conflict of Interest
The authors declared no potential conflicts of interest with respect to the research, authorship, and/or publication of this article.
References
- Pitas, Ioannis, and A. Venetsanopoulos. "Nonlinear mean filters in image processing."IEEE Transactions on Acoustics, Speech, and Signal Processing,Vol. 34, No. 3, 1986, pp. 573-84.
- Aja-Fernández, Santiago, Carlos Alberola-López, and Carl-Fredrik Westin. "Noise and signal estimation in magnitude MRI and Rician distributed images: A LMMSE approach."IEEE Transactions on Image Processing,Vol. 17, No. 8, 2008, pp. 1383-98.
- Mohan, J., V. Krishnaveni, and Yanhui Guo. "A survey on the magnetic resonance image denoising methods."Biomedical Signal Processing and Control,Vol. 9, 2014, pp. 56-69.
- You, Yu-Li, et al. "Behavioral analysis of anisotropic diffusion in image processing."IEEE Transactions on Image Processing,Vol. 5, No. 11, 1996, pp. 1539-53.
- Meenakshy, K., and C. Shwetha. "Combined NLM-Weiner filter based image denoising."2015 International Conference on Power, Instrumentation, Control and Computing (PICC). IEEE, 2015.
- Chaudhury, Kunal N., and Swapnil D. Dabhade. "Fast and provably accurate bilateral filtering."IEEE Transactions on Image Processing,Vol. 25, No. 6, 2016, pp. 2519-28.
- Chang, Herng-Hua, Cheng-Yuan Li, and Audrey Haihong Gallogly. "Brain MR image restoration using an automatic trilateral filter with GPU-based acceleration."IEEE Transactions on Biomedical Engineering,Vol. 65, No. 2, 2017, pp. 400-13.
- Chen, Kaixin, et al. "An enhanced adaptive non-local means algorithm for Rician noise reduction in magnetic resonance brain images."BMC Medical Imaging,Vol. 20, No. 1, 2020, pp. 1-9.
- BrainWeb: Simulated brain database for synthetic MR images. http://www.bic.mni.mcgill.ca/brainweb/
- National Library of Medicine, USA. The Visible Human Data. https://www.nlm.nih.gov/research/visible/visible_human.html
- BRATS. "Multimodal brain tumor segmentation challenge." 2012. http://www.imm.dtu.dk/projects/BRATS2012/
- Aarya, Isshaa, Danchi Jiang, and Timothy Gale. "Signal dependent Rician noise denoising using nonlinear filter."Lecture Notes on Software Engineering,Vol. 1, No. 4, 2013, pp. 344-49.
- Saleh, Sami Abdulla Mohsen, and Haidi Ibrahim. "Mathematical equations for homomorphic filtering in frequency domain: A literature survey."Proceedings of the International Conference on Information and Knowledge Management, Vol. 45, 2012, pp. 74-77.
- Rajan, Jeny, K. Kannan, and M. R. Kaimal. "An improved hybrid model for molecular image denoising."Journal of Mathematical Imaging and Vision,Vol. 31, No. 1, 2008, pp. 73-79.
- Liu, X. Y., C-H. Lai, and Kyriacos A. Pericleous. "A fourth-order partial differential equation denoising model with an adaptive relaxation method."International Journal of Computer Mathematics,Vol. 92, No. 3, 2015, pp. 608-22.
- Lai, Rui, et al. "Local and nonlocal steering kernel weighted total variation model for image denoising."Symmetry,Vol. 11, No. 3, 2019, p. 329.
- Khaparde, Arti, and Vaidehi Deshmukh. "Optimized multi-focus image fusion using genetic algorithm."Advances in Science Technology and Engineering Systems Journal,Vol. 2, No. 1, 2017, pp. 51-56.