Research Article - International Journal of Medical Research & Health Sciences ( 2025) Volume 14, Issue 2
Evaluation of Technical Parameter on CT-scan used for Pediatric and Adult Diagnosis in Two Governmental Referal Hospitals in Ethiopia
Alemu Motuma Defersha1*, Siefe Teferi2, Desta Regasa3 and Aman Wase42Department of Medical Physics, Addis Abeba University, Addis Ababa, Ethiopia
3Department of Material Physics, Salale University, Fiche, Ethiopia
4Department of Statistical and Computational Physics, University of Gondar, Gondar, Ethiopia
Alemu Motuma Defersha, Department of Medical Physics, Salale University, Fiche, Ethiopia, Email: alemumotumma@yahoo.com
Received: 23-Aug-2023, Manuscript No. IJMRHS-23-111098; Editor assigned: 28-Aug-2023, Pre QC No. IJMRHS-23-111098 (PQ); Reviewed: 12-Sep-2023, QC No. IJMRHS-23-111098; Revised: 01-Apr-2025, Manuscript No. IJMRHS-23-111098 (R); Published: 08-Apr-2025
Abstract
The main aim of this study was to reveal technical parameters on CT scan used for pediatric and adult diagnosis in Tikur Anbesa and Yekatit 12 specialized hospitals in Addis Ababa, Ethiopia. Thus, KV, mA, Eff.mAs, pitch, table feed and rotation times were among explored technical parameters in line of three leading questions. Data on head, neck, chest, abdomen and the pelvic scan regions were collected from a total of 154 patients (22 pediatrics and 132 adults). The data were analyzed through descriptive statistics on microsoft excel and t-test using SPSS software 21 version. The results were presented in the table, line graph and histogram. From t-test report results, it could have concluded that the ED from pediatric resulted in higher than that of adult, t (139)=-0.539, P=0.591. And pitch from pediatric scored higher than that of adult, t (139)=0.385, P=0.701. And for different scan regions and ages 120 KV was used and pediatric exposed to high radiation dose. Based on these results the following recommendations were made. The medical technologist should have selected the appropriate KV based on age and scan regions. The Ethiopian radiation authority should have made survey study on diagnosis dose to reduce the adverse health impacts of doses. Relevant authorities should monitor the radiation management implementation in CT scan medical imaging procedure in hospitals where CT scan machines are employed.
Keywords
Effects, CT scan, Technical parameters, Diagnosis dose descriptorsIntroduction
CT scans can be performed on every region of the body for a variety of reasons. It can show detailed images of any part of the body, including the bones, muscles, fat and organs. Additionally, CT imaging is one of the fastest and most accurate tools for examining the chest, abdomen and pelvis because it provides detailed, cross-sectional views of all types of tissue [1]. Hence, CT scan is the best method for diagnosing disease and detecting cancers; its readings confirm the presence of a tumor, measure its size, identify its precise location and determine the extent of its involvement with other nearby tissue. In this way, CT images of organs, bones, soft tissues and blood vessels provide more detail information.
A study identified that about 69 million CT examinations are executed per year for all ages in the USA in 2007 and approximately 10% growth rate per year was recorded [2]. The frequency of pediatric CT examinations has been increasing over the past 20 years and a 40%-50% increase in pediatric CT was documented from 2005/06. Thus, more than 60 million computed tomography scans are estimated to be performed annually in the USA, with 7 million children [3]. Similarly, the CT scan client document from the two hospitals in Ethiopia namely Tikur Anbesa specialized referral hospital and Yekatit 12 special referral hospital shows the acceleration of 47.5% in 2017 from the previous year. Even though CT is young technology in African’s countries including Ethiopia, nowadays, it is widely used by these nations now a day. Moreover, radiation dose in X-ray CT has become a topic of high interest due to the increasing numbers of CT examinations performed worldwide [4,5]. CT examination comprises only 17% of all radiological examinations but contributes to 49% of the ED all radiological examinations.
Patients are exposed to higher radiation levels from using of CT compared to most imaging techniques. Radiation protection in CT deserves special attention since CT is by far the largest contributor to patient radiation exposure in diagnostic radiology. Researchers estimate that in U.S. approximately 29,000 cases and 15,000 deaths per year will stem from CT scans alone [6]. The use of pediatric CT continues to grow despite evidence on known risks of CT related radiation and induction of fatal cancers in children, so; pediatric radiologists apply the practice of ALARA to reduce radiation exposure. Because pediatric patients are smaller, and therefore easier to penetrate, the CT scan mA used to scan pediatric patients is generally reduced relative to those used for adults [7]. In contrast to the application of ALARA and having experience with it, there is lack of awareness on ionization in our country. Some studies show that clinicians, senior medical students and interns have lack of awareness of ionization radiation dose [8,9]. There is also a shortage of information about patient radiation dose in diagnostic medical radiology in our country, Ethiopia [10].
Materials and Methods
The intention of this study was to assess the technical parameters selection used on CT scan for pediatric and adult diagnosis in Tikur Anbesa and Yekatit 12 specialized hospitals. More specifically, the study aimed at answering the following basic questions:
• To what extent the technical parameters selection used on CT scan for adult and pediatric varies during CT scans diagnosis in Tikur Anbesa and Yekatit 12 special referral hospitals?
• Is there statistically significant mean difference among patient age categories of technical parameters selection used on CT scan for adult and pediatric CT scans diagnosis doses in Tikur Anbesa and Yekatit 12 special referral hospitals?
• How could the output diagnostic doses of CT scan selected technical parameters be interpreted in a perspective of other research results and estimated effective dose levels?
In this study comparative design was implemented. Simple statistics and correlation analysis were used to reveal the status of the technical parameters and their outputs doses descriptors relationship and their magnitude. To assess the issue under study, mixed research (explanatory design) approaches have been employed. The study population was patients who have undertaken CT scan in Tikur Anbesa and Yekatit 12 specialized referral hospitals of Addis Ababa, Ethiopia from June 1-30, 2017.
Sample size

Where,
n is the sample size, N is the population size and e is the level of precision.
The sample size of this study was 154 (22 pediatric and 132 adults) who came for different CT scan diagnosis to Tikur Anbesa and Yekatit 12 specialized hospitals from June 1-30, 2017.
Sampling techniques
In order to address the significance of this study, a multistage sampling technique has been used. Firstly, purpose sampling technique has applied to identify the specialized referral hospitals. Next to this, stratified sampling technique has been used to identify the sample into pediatric and adults and finally the lottery sampling technique were applied to identify the participant. The primary data were obtained from the inputs of CT machine and the result of the inputs that displayed as output and the secondary data were obtained from DLP and k-factors results.
CT scan is the new medical technology used for sophisticated medical diagnosis. The measurements were scan region of head, neck, abdomen, pelvic and chest each using GE-64 slice CT scan machine. CT use X-ray energy for scanning the patients’ tissues. The output dosimeter report displayed on the screen specifies radiation dose delivered to the client.
The study used mixed data analyses techniques which have been fit to the qualitative and quantitative data. In this case, quantitative data analysis techniques namely simple statics and correlation, simple statics and independent Ttest (α=0.05) were used to address the first two basic questions respectively. SPSS software of 2l version and Microsoft excel of 2016 were implemented to analyses the data. Tables, line graph and bar graphs were employed to describe the results of analyzed data.
Results
The results of 22 pediatric and 132 adults who underwent for abdomen, PNS, brain, head and neck, abdomen-pelvic and chest CT examinations for different diagnosis to Tikur Anbesa and Yekatit 12 specialized hospitals from June 1-30, 2017 were presented as follows.
The technical parameters selection used on CT scan for adult and pediatric during CT scans diagnosis in Tikur Anbesa and Yekatit 12 special referral hospitals.
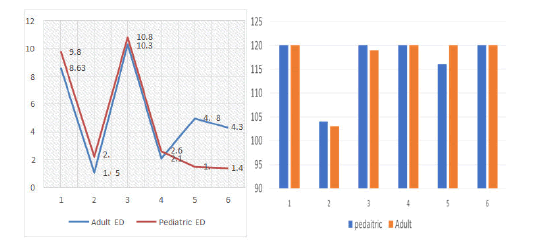
As observed from Figure 1 the average KV used for pediatric and adults CT scans were equal (120 kV) in most CT examinations and some significant difference in the rest. Further the average ED of pediatric patients was greater than the adults for 1, 2, 3 and 4 and the inverse was true for points 5 and 6.
Figure 1. Adult’s and pediatric’s average KV and ED.
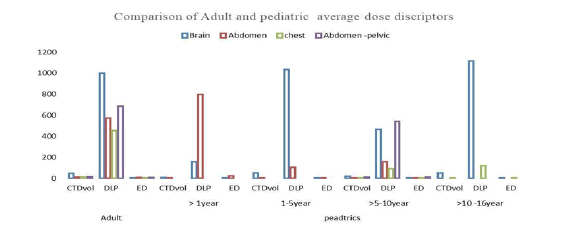
Figure 2 depicted pediatric and adult comparisons dose descriptors were done between abdomen, abdomen-pelvic, brain, chest, head and neck and PNS CT scan examinations. Hence, the comparison illustrations on the figures were done respectively according to these scan regions.
Figure 2. Comparison of adult’s and pediatric diagnosis doses.
As illustrated in Figure 2, the abdomen average DLP and ED of early pediatric was larger than the younger pediatric and adults. Similarly, the average DLP of younger pediatric was larger than the adults and the abdomen and abdomen-pelvic average DLP of younger pediatric was larger than the youngest pediatric.
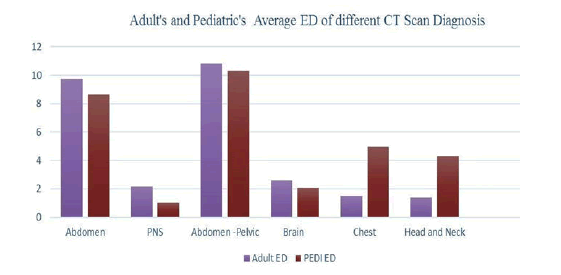
As illustrated in Figure 3, ED of pediatric chest and neck was significantly greater than the adults. In the case of brain and abdomen-pelvic CT scan the pediatric’s and adult`s ED were nearly equals to each other. But, in abdomen and PNS the ED of adult were significantly greater than the pediatric’s.
Figure 3. Adult's and pediatric average ED of different CT scan diagnosis doses.
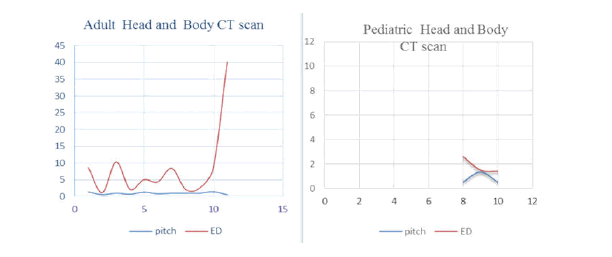
As illustrated on Figure 4 the pediatric’s and adult`s head and body CT scan pitch was inversely proportional to average ED.
Figure 4. Pitch verses ED graph of adult`s and pediatrics’ head and body CT scan.
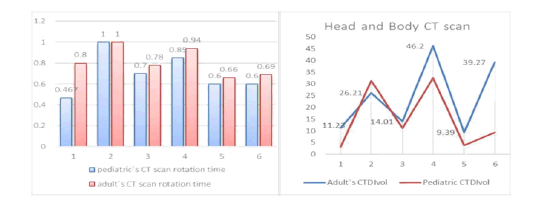
As observed from the Figure 5 above the rotation time of CT scan for pediatric and adults at point two was equal to each other. But for others points adult`s CT scan rotation times were larger than the pediatric with different degree. The fast scanning reduces dose to patients and slow scanning imparted dose to the patients. The pediatric CTDIvol for point 2 was greater than the adult but at other points the reverse was true.
Figure 5. Adults and paediatrics head and body CT scan rotation time and CTDIvol.
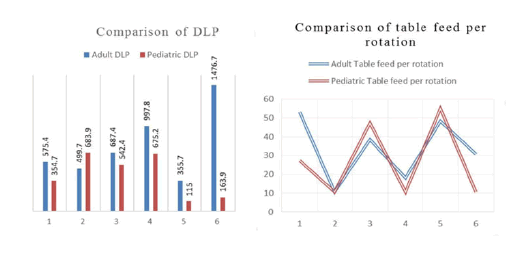
As can be seen from the Figure 6 pediatric CT scan table feed at points 3 and 5 larger than the adults, whereas points 1, 4 and 6 it was less than adults. Similarly, the pediatric CT scan DLP at point 2 was larger than the adults but at the rest points, the DLP of adult's was greater than the pediatrics' DLP.
Figure 6. Adult's and Pediatrics CT scan table feed and DLP.
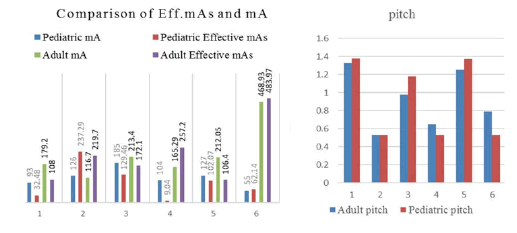
As illustrated on Figure 7 at point 1, 3 and 5 pediatric CT scan pitch was larger than the adults. And at point 4 and 6 the adult CT scan pitch was larger than pediatric and equal at point two. Further Eff.mAs of pediatric CT scan at point 2, and mA at point 2 and 5 were greater than adult's.
Figure 7. Adult and pediatric CT scan Eff.mAs, mA and pitch.
The statistical mean differences among patient’s age categories of technical parameters selection used on CT scan for adult and pediatric CT scans diagnosis doses in Tikur Anbesa and Yekatit 12 special referral hospitals.
Pediatric’s and adult’s CT scan technical parameters used and diagnosis doses mean difference
As depicted by above Table 1 using an alpha level of 0.05 an independent sample t-test was conducted to evaluate whether the average outputs dose descriptor has differed significantly as a function of age in pediatric or in adults. The t-test was significantly (34)=-2.74, p=0.05 with range of 3 to 20. An examination of the group means indicates that patient in adults (m=30.6, SD=22) significantly more CTDIvol than in pediatric (m=18.7, SD=17.89). Similarly, the test was significant t (139)=-2.634, p=0.05 with range 91 to 641.6. The group means to indicate that patients in adult aged (m=837, SD=630) significantly more DLP than in patients pediatric aged (m=470.8, SD=386). Finally, the test was significant t (139)=-0.539, p=0.59 with range 1 to 2. The group means indicates that patients in pediatric (m=4, SD=5.7) significantly exposed more ED than patients in adult (m=4, SD=3.70). The magnitude of the mean difference in means (mean difference=11.9, 95% Cl: 20.7 to -3). Based on each t-test report results it could have concluded as the ED from pediatric resulted higher than the adult, t (139)=-0.539, P=0.591.
| Independent samples t-test | ||||||
|---|---|---|---|---|---|---|
| In put variable | Age | N | Mean | Standard deviation | t | Sig. (2-tailed) |
| KV | <=15 | 22 | 116.3636 | 7.89542 | -2.229 | 0.027 |
| 16-93 | 119 | 118.9916 | 4.39471 | -1.518 | 0.142 | |
| mA | <=15 | 22 | 112.4545 | 44.1391 | -4.189 | 0 |
| 16-93 | 119 | 214.7311 | 112.6616 | -7.32 | 0 | |
| Eff.mAs | <=15 | 22 | 75.724 | 100.3275 | -4.402 | 0 |
| 16-93 | 119 | 231.3966 | 159.8836 | -6.004 | 0 | |
| Rotation time | <=15 | 22 | 0.75 | 0.22414 | -2.129 | 0.035 |
| 16-93 | 119 | 0.8303 | 0.14875 | -1.615 | 0.119 | |
| Pitch | <=15 | 22 | 0.8969 | 0.41812 | 0.385 | 0.701 |
| 16-93 | 119 | 0.8662 | 0.32869 | 0.326 | 0.747 | |
| Table feed | <=15 | 22 | 25.0727 | 18.54283 | -1.272 | 0.205 |
| 16-93 | 119 | 30.2874 | 17.49779 | -1.222 | 0.232 | |
| CTDIvol | <=15 | 22 | 18.69455 | 17.97707 | -2.362 | 0.02 |
| 16-93 | 119 | 30.60185 | 22.32636 | -2.74 | 0.01 | |
| DLP | <=15 | 22 | 470.8414 | 386.4365 | -2.634 | 0.009 |
| 16-93 | 119 | 837.3752 | 629.9363 | -3.643 | 0.001 | |
| ED | <=15 | 22 | 3.92792 | 5.680669 | -0.539 | 0.591 |
| 16-93 | 119 | 4.43916 | 3.735641 | -0.406 | 0.688 | |
Table 1. Independent samples t-test of input and output variables.
In the case of the average inputs technical parameters, the test was significant t (23.5)=-1.518, p=0.142 with range -6 to 0.95. The group means indicated that the patients in pediatric age (m=116, SD=7.9) significantly more kV than adult age (m=118.99, SD=4). The test was significant t (81.11)=-7.32, p=0.00 with range -130 to -74. The group means indicated that patients in pediatric (m=112.4, SD=44) significantly lower mA than Adult (m=214.7, SD=112.7). The test was significant, t (139)=-4.402, p=0.00 with range -85.8 to -225.6. The group means indicated that the patients in pediatric age (m=75.7, SD=100) significantly lower Eff.mAs than adult (m=231, SD=160). The test was significant, t (139)=-2.129, p=0.35 with range -0.15 to -0.006. The group means indicated that the patients in pediatric age (m=0.75, SD=0.22) significantly more rotation time than adult aged (m=0.9, SD=160). The test was significant, t (139)=0.385, p=0.701 with range -0.13 to -0.2. The group means indicated that the patient in pediatric (m=0.8, SD=0.14) significantly more pitch than the adult in m (0.9, SD=0.3). The test was significant, t (139)=-1.272, p=0.205 with range -13 to 3. The group means indicated that patients age in pediatric (m=25, SD=18.5) significantly lower table feed than adult age (m=30, SD=17). Based on each t-test report results it could conclude as the pitch from pediatric scored higher than the adult, t (139)=0.385, P=0.701.
The outputs diagnosis doses of CT scan selected parameters interpretation in a perspective of other research results and estimated dose levels.
Comparison of technical parameters and doses descriptors with others studies
As observed from Table 2 the KV used in pediatric brain, chest and abdomen examination in this study was greater than that of the KV in the literature reviewed. The pitch in brain examination in this study was less than the pitch in the literature reviewed. Since pitch was inversely proportional to dose then the pediatric brain dose in this study was larger than that of the pediatric brain dose for the literature reviewed. Similarly, the acquisition time for the pediatric brain in this study was larger than in literature reviewed. In the case of pediatric chest examination, the KV, time and pitch used for acquisition in the literature reviewed were less than that of this study. And in abdomen examination, the KV and pitch used for acquisitions in literature were less than the acquisitions used in this study. The time of acquisition used in both case nearly equal.
| Examination and age | Acquisition parameter | |||||
|---|---|---|---|---|---|---|
| KV | Time(s) | Pitch | ||||
| Brain | In others studies | This study | In other studies | This study | In other studies | This study |
| 0-1 year | 100 | 120 | 0.5 | 0.5,0.6 | 0.98 | 0.531 |
| 2-5 years | 100 | 120 | 0.5 | 1 | 0.98 | 0.531 |
| 6-10 years | 100 | 120 | 1 | 1 | 0.98 | 0.531 |
| 11-15 years | 120 | 120 | 1 | 1 | 0.98 | 0.531 |
| Chest | ||||||
| 0-1 year | 90 | - | 0.5 | - | 0.9 | - |
| 2-5 years | 90 | - | 0.5 | - | 0.9 | - |
| 6-10 years | 100 | 120 | 0.5 | 0.6 | 1 | 1.375 |
| 11-15 years | 100 | 120 | 0.5 | 0.6 | 1.2 | 1.375 |
| Abdomen | ||||||
| 0-1 year | 70 | 120 | 0.5 | 0.4 | 0.9 | 1.375 |
| 2-5 years | 80 | 120 | 0.5 | 0.5 | 0.9 | 1.375 |
| 6-10 years | 100 | 120 | 0.5 | 0.5 | 1.3 | 1.375 |
| 11-15 years | 120 | - | 0.5 | - | 1.3 | - |
Table 2. The optimized acquisition parameters of pediatric specific to age using 64-slice computed tomography system study and in this study.
Comparison of doses descriptors
As can be seen from Table 3 the chest CT scan CTDIvol of this study was greater than Luxembourg and Ireland and less than Turkey and Italy. The HRCT-chest CT scan CTDIvol of this study was larger than Turkey and Luxembourg. The CTDIvol of Turkey and Italy were greater than this study but the CTDIvol value obtained from this study was greater than Ireland.
| Adult examination | This study | Turkey 2014 | Italy 2014 | Luxembourg 2014 | Ireland 2012 |
|---|---|---|---|---|---|
| Chest | 11.25958 | 11.6 | 15 | 6.8 | 9.3 |
| HRCT-chest | 12.34703 | 11.3 | - | - | 6.6 |
| Abdominal | 11.23444 | 13.3 | 18 | 9.6 | 12.3 |
| Pelvic | 13.23 | 19.4 | 18 | - | 12.3 |
Table 3. CTDIvol for adults and pediatric from the study and other countries.
As can be seen from Table 4 the DLP of adult chest of this study was larger than DLP of Turkey and Ireland but smaller than Italy in the literature.
| Adult examination | This study | Turkey 2014 | Italy 2014 | EC 2011 | Ireland 2012 |
|---|---|---|---|---|---|
| Chest | 454.3588 | 289 | 569 | 394 | 393 |
| HRCT-chest | 598.94 | 283 | - | - | 276 |
| Abdominal | 575.3489 | 204 | 555 | 464 | 598 |
| Pelvic | 568.05 | 421 | 360 | 434 | 598 |
Table 4. DLP for adults in this study and other countries.
As observed from Table 5, the DLP chest CT scan of 5-10 years old pediatric this study was larger than in Kenya but smaller than in Turkey and in Germany in literature. Similarly, for 10-15 years old pediatric was smaller than in Turkey and in Germany.
| In other countries | 1 year | 1-5 years | 5-10 years | 10-15 years |
|---|---|---|---|---|
| This study | - | - | 92.85 | 120.4775 |
| In Kenya | 6 | 6.5 | 10 | - |
| In Turkey | 181 | 214 | 277 | 287 |
| In Germany | - | 100 | 300 | 800 |
Table 5. DLP for pediatric chest CT scan from this study and other countries.
As illustrated in Table 6 the mean DLP value of chest in this study was small next to Kenyan and almost near to the average value of the African. But the mean DLP value of abdomen in this study was the larger than the other countries in the table and Africa too.
| Countries | Scan region | |
|---|---|---|
| Chest | Abdomen | |
| this study | 114.95 | 354.59 |
| In Kenya | 103 | 124 |
| In Algeria | 169 | 121 |
| In Tanzania | 144 | 187 |
| In Ghana | 272 | 320 |
| Africa | 85.5-272 (153) | 43.4-320 (180) |
Table 6. Mean DLP values for pediatric patients in this study and different countries.
As shown in Table 7, ED of adult chest CT scan of this study was larger than in Turkey, in Syria and Ireland but smaller than in Italy in literature. The ED of HRCT-chest of adults in this study was twice of the ED adults in Turkey in literature. Similarly, the Abdominal CT scan of adult this study was larger ED adults in Turkey, Italy, Syria and Ireland. Similarly, ED of pelvic in this study was larger than ED in Turkey, Syria, and Ireland smaller than Italy in the literature.
| Adult examination | In this study | In Turkey 2014 | In Italy 2014 | In Syria 2009 |
In Ireland 2012 |
|---|---|---|---|---|---|
|
Chest |
6.361052 |
4.1 |
8 |
5.4 |
6.2 |
|
HRCT-chest |
8.382407 |
4 |
- |
- |
- |
|
Abdominal |
8.628667 |
3.1 |
7.8 |
7.7 |
8.3 |
|
Pelvic |
8.5208 |
6.3 |
8.9 |
6.8 |
8.2 |
Table 7. ED of adults from this study and in other countries.
As seen on Table 8, in dose value; max CTDIvol of this study was larger than the other dose values in Al-Ribat University Hospital Khartoum, Sudan. Similarly, the max and min DLP values were larger than the value obtained from the brain CT scan of the Sudan and the ED of this study were larger than the ED of the brain CT scan obtained in Al-Ribat University Hospital Khartoum. For acquisition parameters, table feed of this study was larger than that of the Al-Ribat University Hospital but the time of rotation was smaller than it in the adult case. In the pediatric brain CT scan, the value of rotation time and table feed in Al-Ribat University Hospital was larger than the value of this study. Similarly, the values of CTDIvol and DLP in Al-Ribat University Hospital were larger than the value obtains in this study. But ED of this study was larger than the value obtained in Al-Ribat University Hospital Khartoum, Sudan this show other acquisition parameters highly dominate the parameter illustrated in this table.
| Value | Adult doses and acquisition parameters | |||||||||
|---|---|---|---|---|---|---|---|---|---|---|
| CTDIvol | DLP | ED | Rotation time | Table feed | ||||||
| In Khart oum | This study | In Khart oum | This study | In Khart oum | This study | In Khart oum | This study | In Khart oum | This study | |
| Average | 67.43 | 46.24 | 1000.25 | 997.98 | 0.48 | 2.099 | 2.4 | 0.942 | 17.84 | 18.16 |
| Maximum | 69.12 | 84.25 | 1419 | 31341 | 0.49 | 6.58 | 2.5 | 1 | 19.5 | 39.4 |
| Minimum | 63 | 22.75 | 323 | 461.82 | 0.44 | 0.97 | 1 | 0.8 | 1 | 10.6 |
| Value | Pediatric doses and acquisition parameters | |||||||||
| CTDIvol | DLP | ED | Rotation | Table feed | ||||||
| In Khart oum | This study | In Khart oum | This study | In Khart oum | This study | In Khart oum | This study | In Khart oum | This study | |
| Average | 43.67 | 32.46 | 733.33 | 675.23 | 0.31 | 2.6 | 2.28 | 0.85 | 18.25 | 10.6 |
| Maximum | 69.12 | 52.62 | 1244 | 113469 | 0.49 | 4.13 | 2.5 | 1 | 19 | - |
| Minimum | 15.41 | 9.28 | 297 | 149.73 | 0.11 | 1 | 1.8 | 0.5 | 18 | - |
Table 8. Brain CT scan acquisition parameters and dose mean values for pediatric and adult in Khartoum and this study.
As depicted in the above Table 9, most ED values of pediatric fall under medium dose and few under high dose. Similarly, the ED values of adult falls under medium dose and some under high dose.
| Average ED and level | ||||
|---|---|---|---|---|
| Examination | Adult | Pediatric | ||
| ED | Rank | ED | Rank | |
| Abdomen | 8.628667 | Medium | 9.760033 | Medium |
| PNS | 1.05 | Medium | 2.188595 | Medium |
| Abdomen-pelvic | 10.31134 | High | 10.8477 | High |
| Brain | 2.098975 | Medium | 2.605273 | Medium |
| Chest | 4.980004 | Medium | 1.494324 | Medium |
| Head and neck | 4.31625 | Medium | 1.3923 | Medium |
Table 9. Average estimated effective dose level.
Dose level; minimal dose: Less than 0.1 mSv, low Dose: 0.1 to 1 mSv, medium dose: 1 to 10mSv, High dose: 10 mSv and over [6].
Discussion
The technical parameters selection used on CT scan for adult and pediatric during diagnosis in Tikur Anbesa and Yekatit 12 special referral hospitals.
As observed from Figure 1 most pediatric and adult scan underwent using 120 KV and ED of pediatric was greater than adult and this contradicts with the principle of KV reduction in pediatric patients [14]. If identical CT head examination protocol was used: Adult dose; 1.5 mSv, child dose; 6 mSv exposed and 80 KV was usually adequate for children and can be successfully performed using it [15]. Figure 2 give a picture of the abdomen average DLP and ED of early pediatric was larger than the younger pediatric and adult. Similarly, the average DLP of younger pediatric was larger than the adults and the abdomen and abdomen-pelvic average DLP of younger pediatric were larger than the youngest pediatric. This finding disagrees with principles of radiation protection in a pediatric patient which entails the use of fewer radiation doses in the very young children. Figure 3 also portrayed that ED of pediatric chest and neck is significantly greater than the adults. In the case of brain and abdomen-pelvic CT scan, the pediatric’s and adult`s ED were nearly equal to one other. But in abdomen and PNS CT scan the ED of the adult were significantly greater than the pediatric’s. Figure 4, ED decrease as pitch increase in adult and pediatric head and body CT scan. Figure 5 indicated that all CT scan rotation time of adult's CT scan were greater than pediatric except PNS CT scans whose result was equal. Similarly, CTDIvol of the adults were greater than that of pediatric except for PNS in the case in which the pediatric was larger. Figure 6 also indicated that the table feed of pediatric’ abdomen pelvic and chest CT scan was larger than the adults, but less for the abdomen, brain and head and neck CT scans. And the pediatric DLP for PNS was larger than the adult's, but at for the rest, DLP of adult`s was greater than the pediatric’. Figure 7 designated that pediatric CT scan pitch of abdomen, abdomen-pelvic and chests CT scan were larger than the adult's. Brain and Head and Neck adult's CT scan pitches were larger than pediatric and equal to one another for PNS. Pediatric Eff.mAs and mA of PNS and mA of Chest were greater than the adult. This contradicts with the theoretical facts that lower mA should be used for scanning kids.
The statistical mean differences among patient’s age categories of selected technical parameters used on CT scan for adult and pediatric CT scans diagnosis doses in Tikur Anbesa and Yekatit 12 special referral hospitals.
As depicted by Table 1 using an alpha level of 0.05 an independent sample t-test was conducted to evaluate whether the average outputs dose descriptor has differed significantly as a function of age in pediatric or in adults. The t-test was significantly (34)=-2.74, p=0.05 with range of 3 to 20. An examination of the group means indicates that patient in adults (m=30.6, SD=22) significantly more CTDIvol than in pediatric (m=18.7, SD=17.89). Similarly, the test was significant t (139)=-2.634, p=0.05 with range 91 to 641.6. The group means to indicate that patients in adult aged (m=837, SD=630) significantly more DLP than in patients pediatric aged (m=470.8, SD=386). Finally, the test was significant t (139)=-0.539, p=0.59 with range 1 to 2. The group means indicates that patients in pediatric (m=4, SD=5.7) significantly exposed more ED than patients in adult (m=4, SD=3.70). The magnitude of the mean difference in means (mean difference=11.9, 95% Cl: 20.7 to -3). Based on each t-test report results it could have concluded as the ED from pediatric resulted higher than the adult, t (139)=-0.539, P=0.591.
In the case of the average inputs technical parameters, the test was significant t (23.5)=-1.518, p=0.142 with range -6 to 0.95. The group means indicated that the patients in pediatric age (m=116, SD=7.9) significantly more kV than adult age (m=118.99, SD=4). The test was significant t (81.11)=-7.32, p=0.00 with range -130 to -74. The group means indicated that patients in pediatric (m=112.4, SD=44) significantly lower mA than Adult (m=214.7, SD=112.7). The test was significant, t (139)=-4.402, p=0.00 with range -85.8 to -225.6. The group means indicated that the patients in pediatric age (m=75.7, SD=100) significantly lower Eff.mAs than adult (m=231, SD=160). The test was significant, t (139)=-2.129, p=0.35 with range -0.15 to -0.006. The group means indicated that the patients in pediatric age (m=0.75, SD=0.22) significantly more rotation time than adult aged (m=0.9, SD=160). The test was significant, t (139)=0.385, p=0.701 with range -0.13 to -0.2. The group means indicated that the patient in pediatric (m=0.8, SD=0.14) significantly more pitch than the adult in m (0.9, SD=0.3). The test was significant, t (139)=-1.272, p=0.205 with range -13 to 3. The group means indicated that patients age in pediatric (m=25, SD=18.5) significantly lower table feed than adult age (m=30, SD=17). Based on each t-test report results it could conclude as the pitch from pediatric scored higher than the adult, t (139)=0.385, P=0.701.
Interpretation of output diagnosis dose descriptors of used technical parameters in respective of other research results and estimated effective dose levels.
Table 2 designated that for this study, the 0-10 years old pediatric brain CT scan KV was larger, the pitch was smaller, and the rotation time was equals to results obtained from the other studies. And 6-15 years old pediatric chest CT the KV, time of rotation and pitch were larger than that of the other studies. Similarly, the pediatric abdomen CT scans KV and pitches were larger than that of other studies. As indicated in Table 1:3 the chest CT scan CTDIvol of this study was greater than Luxembourg and Ireland and less than Turkey and Italy in the literature. The HRCT-chest CT scan CTDIvol of this study was larger than Turkey and Luxembourg. The CTDIvol of Turkey and Italy were greater than that of this study but CTDIvol value obtained from this study was greater than that of Ireland. As indicated in Table 3, Table 4 showed that the DLP of the adult chest of this study was larger than DLP of Turkish and Ireland’s but smaller than that of Italy in the literature. Table 5 indicated that the DLP chest CT scan of 5-10 years old pediatric this study was larger than Kenya, Ireland and smaller than Turkey and Germany in literature. For 10-15 years old pediatrics, it was smaller than that of Turkish and Germany’s. Table 6 designated that the mean DLP value of chest in this study was small next to that of Kenyan and almost near to the average value of the African. But, the mean DLP value of abdomen in this study was larger than the others countries in the table and African too.
Table 7 signifies that the ED of adult chest CT scan of this study was larger than Turkish, Syrian and Ireland`s but smaller than Italy in the literature. The ED of HRCT-chest of adults in this study was twice of the ED of adults of Turkish study in literature. Similarly, the Abdominal CT scan of adult this study was with larger ED that of Turkish, Italy’s, Syrian and Ireland’s studies. Similarly, ED of pelvic in this study was larger than ED in Turkey, Syria and Ireland smaller than Italy in the literature. In dose value, Table 8 shows that max CTDIvol of this study was larger than that of dose values in Al-Ribat University Hospital Khartoum’s study. Similarly, the max and min DLP values were larger than the value obtained from the brain CT scan of the Sudan and the ED of this study were larger than the ED of the brain CT scan obtained in Al-Ribat University. For acquisition parameters, table feed of this study was larger than that of the Al-Ribat University Hospital’s but the time of rotation was smaller than it was in adult case. In the pediatric brain CT scan, the value of rotation time and table feed per rotation in Al-Ribat University Hospital was larger than the value of this study. Similarly, the values of CTDIvol and DLP in Al-Ribat University Hospital was larger than value obtain from this study. But, ED of this study was larger than the value obtained from the study of Al-Ribat University Hospital of Khartoum.
The study of estimate effective radiation doses from CT examination of both adult and pediatric in Japan and Impacts of various scan parameters on ED results show that the mean EDs for chest and abdominal examinations using 80-110 KV were significantly lower than those using 120 KV but there was no statistically significant difference for head scans in employing 80-110 KV and 120 KV. Hence, the mean EDs for the adult head, chest and abdominal CT examinations were 2.9, 7.7 and 10.0 mSv, respectively, whereas the corresponding mean EDs for pediatric examinations were 2.6, 7.1 and 7.7 mSv, respectively. From the study result of Royal Children`s Hospital Melbourne of Parkville Australia, the dose descriptors across all age for brain examinations were 18-45 mGy (CTDIvol) and 250-700 smGy -cm (DLP), for chest 3-23 mGy (CTDIvol) and 100-800 may cm (DLP), 4-15 mGy (CTDIvol) and 150-750 may cm (DLP) for abdomen, and pelvic examinations. Additionally, estimated ED for brain, chest, abdomen, and pelvis were 1.0-1.6 mSv, 1.8-13.0 mSv, 2.5-10.0 mSv and 2.5-10.0 mSv respectively. As depicted in Table 9, most ED for pediatric fall under medium dose and few under high dose. Similarly, the Ed for adults falls under medium dose and some under high dose. This contradicts with the principle of radiation usage thus use low dose limit.
Conclusion
The purpose of this study was to explore the CT scan technical parameters selection used on CT scan for pediatric and adult CT scan diagnosis doses in Tikur Anbesa and Yekatit 12 specialized hospitals in Addis Ababa. The variables were KV, mA, Eff.mAs, rotation time, table feed, pitch and age. This study was the comparative mixed research. The study guided by basic questions of, to what extent the technical parameters selection used on CT scan for adult and pediatric varies during CT scans diagnosis in Tikur Anbesa and Yekatit 12 special referral hospitals? Is there statistically significant mean difference among patient age categories of technical parameters selection used on CT scan for adult and pediatric CT scans diagnosis doses in Tikur Anbesa and Yekatit 12 special referral hospitals? How could the output diagnostic doses of CT scan selected technical parameters be interpreted in a perspective of other research results and estimated effective dose levels? The sample size of this study was 154 patients of which 22 were pediatric and 132 were the adult. The main sources of the data were inputs of CT machine and the result of the inputs that displayed as outputs and data that obtained from DLP and k-factors results. Thus, the selected technical parameters KV for pediatric and adult were the same. From t-test report results, it could have concluded that the ED from pediatric resulted in higher than that of adult, t(139)=-0.539, P=0.591. And pitch from pediatric scored higher than that of adult, t (139)=0.385, P=0.701. Thus, technical parameters should be selected based on the age and scan region to avoid radiation health risk.
Based on the basic questions of the study, the analyses of the study and the findings, the following conclusions are reached. The technical parameters used to pediatric violated the radiation safety principle of pediatric. The output of the selected technical parameters results in high pediatric exposure dose relative to adults. This highlights the need to emphasize the selection of appropriate technical parameters for CT examinations in pediatrics. This highlights the need to emphasize the selecting of appropriate technical parameters for CT examinations in pediatrics. Adult CT scan technical parameters were being used in pediatric CT examinations and the doses descriptors and some technical parameters were larger than the value obtained in some countries as others studies thus imparting higher radiation doses in this study. The estimated average effective dose levels were also medium. Generally, the CTDIvol, DLP and ED values in this study were larger than corresponding values in Africa and other Asia and Eastern Europe countries. This would form a basis for future studies on dose management in CT scan.
Based on findings of the study and the conclusion, the following recommendations are forwarded.
• The medical technologist should have to select the appropriated protocols technical based on the age level of the patients.
• On the job training for medical technologist should be prepared as refreshment by the department of radiology to inspire radiation management principles and protection awareness.
• Radiation management focal person should be assigned make consultation as well as supervision of the medical technologists and the institutions.
• Radiation auditing system should be established in institutions which deliver the medical service under high radiation.
References
- RSNA. CT scan imaging modality. Radiologyinfo.org. 2016.
- International Atomic Energy Agency (IEA). Radiation Protection of Children during Computed Tomography. L06, 2017.
- MHRA. Radiation dose issues in multi-slice CT scanning ImPACT Technology updates no. 3., ImPACT, 2005.
- Kalender WA, et al. Dose in x-ray computed tomography. Phys Med Biol, 2014 Jan 17; Vol. 59, No. 3, 2014, pp. 129.
[Crossref] [Google Scholar] [PubMed]
- CT scan imaging modality
- Alsafi KG, et al. Radiation protection in X-ray computed tomography: Literature review. Int J Radiol Imaging Technol, Vol. 2, No. 2, 2016, pp. 1-5.
- Dellie ST, et al. An assessment of final-year medical students and interns awareness of radiation exposure to common diagnostic imaging procedures. Adv Radiol, Vol. 2014, 2014, pp. 1-7.
- Zewdneh D, et al. A study of knowledge and awareness of medical doctors towards radiation exposure risk at Tikur Anbessa specialized referral and teaching hospital, Addis Ababa, Ethiopia. J Pharm Biol Sci, Vol. 2, No. 4, 2012, pp. 1-5.
- Alemayehu Debbo. Entrance surface Dose (ESD) value measurement from mammography on patients undergoing breast Examination using indirect method: The case of Black lion and Betazatha Hospitals, Addis Ababa, Ethiopia. 2012.
- Muhogora WE, et al. Paediatric CT examinations in 19 developing countries: Frequency and radiation dose. Radiat Prot Dosimetry, Vol. 140, No. 1, 2010, pp. 49-58.
[Crossref] [Google Scholar] [PubMed]
- Atac GK, et al. Patient doses from CT examinations in Turkey. Diagn Interv Radiol, Vol. 21, No. 5, 2015, pp. 428.
[Crossref] [Google Scholar] [PubMed]
- Tamboul JY, et al. Measurement of adult and pediatric patient doses during head CT scan. Am J Sci, Vol. 10, No. 2, 2014, pp. 19-23.
- Christner JA, et al. Estimating effective dose for CT using dose–length product compared with using organ doses: Consequences of adopting International Commission on Radiological Protection Publication 103 or dual-energy scanning. AJR Am J Roentgenol, Vol. 194, No. 4, 2010, pp. 881-889.
[Crossref] [Google Scholar] [PubMed]
- Brady Z, et al. Assessment of paediatric CT dose indicators for the purpose of optimisation. Br J Radiol, Vol. 85, No. 1019, 2012, pp. 1488-1498.
[Crossref] [Google Scholar] [PubMed]

