Research Article - International Journal of Medical Research & Health Sciences ( 2025) Volume 14, Issue 1
Investigating the Characteristics of a Gear Pump
Muhmmad Awais*, Muhammad Ashraf and Zargham ZaidiMuhmmad Awais, Department of Mechanical Engineering, National Defence University, Islamabad, Pakistan, Email: awaisowaiskhanmail2@gmail.com
Received: 09-Dec-2023, Manuscript No. IJMRHS-24-122439; Editor assigned: 12-Dec-2023, Pre QC No. IJMRHS-24-122439 (PQ); Reviewed: 28-Dec-2023, QC No. IJMRHS-24-122439; Revised: 03-Feb-2025, Manuscript No. IJMRHS-24-122439 (R); Published: 10-Feb-2025
Abstract
This study explores the operation of gear pumps and the effects of several variables on their efficiency. Through the analysis of many graphs, including “discharge vs. head, discharge vs. input power, discharge vs. efficiency, and discharge vs. NPSHr.” We were able to obtain valuable insights regarding cavitation concerns, power consumption, and efficiency. It emphasizes how important it is for gear pumps to have the ideal settings in a variety of sectors. A thorough understanding of these pumps' real-world performance requires more research conducted under a variety of settings. Understanding these pumps in fluid systems is essential.
Keywords
Gear pump, Efficiency, Discharge rate, Power input
Introduction
Aim
The purpose of this experiment is to examine a gear pump's characteristic curves in order to determine how well it performs under different operating situations.
Problem analysis
Gear pumps are a common sight in many different industries because of their strength, simplicity, and capacity to handle very viscous fluids. Optimizing their efficiency and dependability in a variety of applications requires an understanding of their performance characteristics under varied operating situations. Data on the pump's performance in terms of head, power input, efficiency, discharge rate and Net Positive Suction Head needed (NPSHr) are gathered in this experiment.
Materials and Methods
Gear pumps are essential in many sectors because of their simple construction and versatility in handling different viscosity fluids. This paper summarizes the main conclusions from studies on the performance of gear pumps, including experimental configurations, analysis of characteristic curves and clarification of crucial calculation formulas [1-4].
Experimental setups
Research by Wang, et al. and Zhang, et al. employed dedicated test rigs to scrutinize the nuanced factors influencing gear pump functionality. These investigations delved into the impact of several variables pump speed, fluid viscosity, inlet pressure and outlet resistance. Their findings emphasized the profound influence of speed on pump efficiency and revealed the direct correlation between pressure fluctuations and discharge rates
Characteristic curves analysis
Sun, et al. stressed how crucial operational circumstances are in determining the performance of gear pumps. Li, et al.’s research also clarified the detrimental effects of wear on pump efficiency and the necessary Net Positive Suction Head (NPSHr). Their research highlighted the significance of monitoring and mitigating wear-induced degradation for optimal pump performance.
Equations and explanations
Mechanical pump power (W)
MP=ω × T
The mechanical pump power, a product of rotational speed (ω) and torque (T), represents the power transmitted to the pump [5-8].
Rotational velocity (ω)
ω=2 × π × n/60
Rotational velocity (ω), calculated as 2 × π times the rotational speed (n) divided by 60, signifies the angular velocity in radians per second.
Hydraulic power (W)
HP=Q × (Poutput−Pinput)
Hydraulic Power (HP) derived from discharge rate (Q) and the pressure differential between output (Poutput) and input (Pinput), represents the energy transmitted to the fluid.
Pump efficiency (%)
η=(HP/MP) × 100
The pump efficiency (η), expressed as the ratio of hydraulic power to mechanical power in percentage, reflects the pump's effectiveness in converting mechanical power into hydraulic power.
Net Positive Suction Head required (NPSHr)
NPSHr= (Pin−Pv)/ρ × g
In order to prevent cavitation, NPSHr is calculated by dividing the fluid density (ρ) and gravitational acceleration (g) by the pressure difference between the inlet pressure (Pin) and vapour pressure (PV)
Experimental setup
Materials and equipment
• Gear pump: An ordinary gear pump that works well for experiments.
• Flow meter: A precise flow meter to gauge the pump's discharge rate.
• Pressure gauge: This is a device that measures the pressure at the pump's inlet and outlet.
• Power meter: A power meter used to gauge the gear pump's power input.
• Fluid container: The experiments made use of a reservoir to hold the fluid, in this case water.
• Control mechanism: Pump speed (RPM) is adjusted manually through control mechanisms.
• Data recording system: A system for gathering and logging experimental data in preparation for analysis.
Results
Experimental procedure
Mounting the gear pump: To guarantee steady operation throughout the experiments, a gear pump was mounted in a stable location [9,10].
Instrumentation setup: Added a power meter to the electrical circuit, installed a flow meter, and placed a pressure gauge at the pump's inlet and outlet sides.
Fluid preparation: Add water to the pump's reservoir.
Operational parameter control: To change the RPM, manually change the pump's speed.
Gathering data: Perform several trial runs by:
• Using a flow metre to record discharge rates.
• Using the pressure gauge to measure pressure differentials (head).
• Monitoring torque and RPM as a measure of power input.
• Gathering more pertinent data for examination.
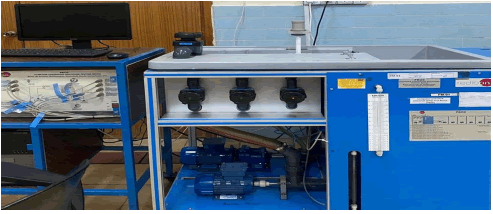
Lab setup
The image of lab setup shows in Figure 1.
Experimental data
Various experimental data available in tables 1and 2.
| 1 | Angular velocity: in (rpm) | Angular velocity (rad/s) | Q (m3/s) | P3 inlet (N/m2) | P4 outlet (N/m2) | Torque (Nm) |
|---|---|---|---|---|---|---|
| 2 | 230 | 24.08554368 | 8.55E-05 | -1100 | 4000 | 0.21 |
| 3 | 280 | 29.32153143 | 9.24E-05 | -1600 | 4300 | 0.2176 |
| 4 | 330 | 34.55752919 | 0.000104 | -2300 | 4800 | 0.2212 |
| 5 | 380 | 39.79350695 | 0.000116 | -2600 | 5600 | 0.2514 |
| 6 | 430 | 45.0294947 | 0.000123 | -3100 | 6400 | 0.2839 |
Table 1 Showing angular velocity in rpm and rad/sec.
| Hydoulic power (W) | Mechanical power (W) | Efficiency | Head (m)=(P4-P3)/(p × g) | NPSHr |
|---|---|---|---|---|
| 0.43605 | 5.057964172 | 8.621058 | 0.520919515 | -0.35108 |
| 0.54516 | 6.38036524 | 8.544338 | 0.60263238 | -0.40215 |
| 0.73627 | 7.644123245 | 9.631844 | 0.725201678 | -0.47365 |
| 0.94792 | 10.00408765 | 9.475327 | 0.837556867 | -0.50429 |
| 1.16565 | 12.78387355 | 9.118128 | 0.970340273 | -0.55536 |
Table 2 Hydrolic power, mechanical power and efficiency
All the calculations and data in the tables are in SI units.
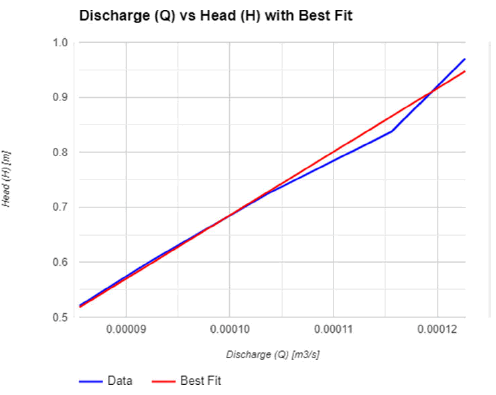
Characteristics curves between Discharge (Q) vs. Head (H) shows in Figure 2.
Analysis
• The plotted curve for the gear pump shows a linear trend that suggests a proportionate relationship and a direct correlation between Discharge (Q) and Head (H).
• The head continuously rises with increased discharge, indicating the pump's capacity to sustain higher heads at higher discharge rates.
• Nevertheless, the pump's behavior is oversimplified by the curve's linearity, which ignores potential nonlinearities and real-world complexities.
• More research conducted in a range of environments is necessary to fully comprehend the functioning of the gear pump [11-14].
• Although validation through a wider range of operational scenarios is necessary for optimization and reliability assessment, this initial linear correlation offers valuable insights.
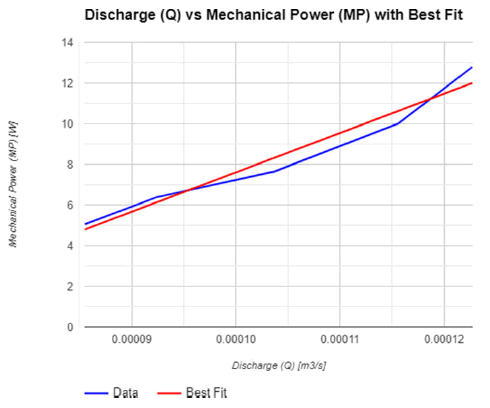
Characteristics curves between Discharge (Q) vs. Input Power (MP) shows in Figure 3.
Analysis
• Linear relationship: The curve shows a direct relationship between Mechanical Power (MP) and Discharge (Q), showing that power consumption rises steadily as discharge rates rise.
• Trend insight: The best-fit linear regression is represented by the red line, and actual data points are shown by blue markers. A proportionate increase in mechanical power as discharge rates rise is suggested by the linear trend.
• Operational behavior: With different discharge rates, the gear pump exhibits a linear power-demand pattern. The pump's need for more mechanical power increases as Q rises, demonstrating its ability to handle higher flow rates at higher power consumption.
• Simplicity and limitation: Although the behavior of the pump is simplified by the linear model, nonlinearities may occur in real-world situations. Additional examination under various circumstances is essential for thorough comprehension.
• Implications for optimization: By balancing power efficiency at various discharge rates, an analysis of this curve helps optimize the pump's performance and ensure effective operation while minimizing excess power consumption.
• Comprehensive understanding: The application of this linear model is restricted to the given dataset, despite its informative nature. A comprehensive assessment of the pump's performance requires a great deal of experimentation under various settings.
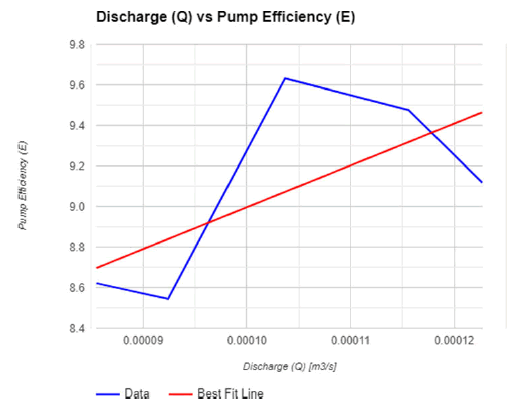
Characteristics curves between Discharge (Q) vs. Efficiency (E) shows in Figure 4.
Discussion
Analysis
• Efficiency trend: For the gear pump, the curve shows a trend that relates the Discharge (Q) and pump Efficiency (E).
• Dataset representation: Measured pump efficiencies corresponding to various discharge rates are shown by blue markers, which represent actual data points.
• Best-fit line: The best-fit linear regression is shown by the red line, which illustrates the general trend of pump efficiency with respect to discharge rates.
• Operational insights: The curve indicates that variations in discharge rates cause variations in pump efficiency. The pattern indicates that the pump performs differently depending on the flow rate and efficiency level.
• Linear model representation: A general trend of pump efficiency in response to discharge is shown by the linear regression line, which models the trend within the provided dataset. It might, however, oversimplify how the pump actually behaves in a variety of operating scenarios.
• Implications for optimisation: By identifying efficiency patterns across a range of discharge rates, an analysis of this curve assists in selecting operational points for increased efficiency, thereby optimising the performance of the gear pump.
• Comprehensive understanding: Although this linear model offers insightful information, a thorough evaluation requires testing under a variety of conditions in order to precisely represent the pump's whole behaviour.
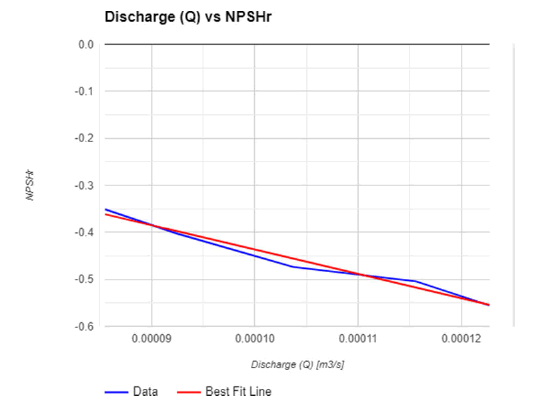
Characteristics curves between Discharge (Q) vs. NPSHr
Analysis
• Linear relationship: Discharge (Q) and NPSHr may have a linear relationship, as indicated by the best fit line's apparent linear trend. A steeper slope denotes a faster rate of NPSHr change in relation to discharge variations.
• NPSHr behavior: There is an inverse relationship, meaning that the required Net Positive Suction Head decreases as the flow rate (discharge) increases.
• Operating range: The gear pump's operating range can be ascertained by looking at the slope and intercept of the best fit line. A steep slope could indicate that NPSHr is greatly impacted by even tiny changes in Discharge.
• Performance consideration: Ensuring that the NPSHr stays above the minimal amount necessary to avoid cavitation is a crucial component of pump design. Understanding how NPSHr changes with different flow rates is essential for optimizing pump performance, and this can be done by analyzing the best fit line.
• This analysis helps to understand the performance characteristics of the gear pump under various operating conditions by providing insightful information about how NPSHr behaves with different Discharge rates.
Applications
• Fluid transport systems: By ensuring ideal flow rates and power utilization while avoiding cavitation, efficient fluid transport systems, such as water treatment plants, can be designed with the help of characteristic curves.
• Oil and gas industry: By optimizing performance and cutting energy usage during drilling operations, these discoveries may play a significant role in the design of pumps used in oil extraction.
• Chemical processing: Using optimized pump designs improves safety and efficiency in chemical manufacturing by helping with accurate chemical dosing, maintaining constant flow rates, and avoiding cavitation.
• Automotive industry: Utilizing water pumps in coolant systems for cars guarantees their best performance, which improves engine longevity and performance.
• Production of food and drinks: Precision handling of viscous fluids, such as syrups, chocolates, and creams, is made possible by optimized gear pumps, which ensure consistent quality in food processing.
• Agriculture and irrigation: Using effective pumps helps regulate irrigation water flow, which helps conserve water and maintain uniform crop hydration.
• Pharmacies: In the production of pharmaceuticals, a thorough comprehension of pump performance aids in the precise dosing and transfer of fragile and sensitive liquids, guaranteeing the safety and quality of the final product.
• Power generation: In thermal power plants, where efficient heat dissipation and system dependability are paramount, gear pumps play a crucial role in power generation for coolant systems.
These applications highlight the value of experimental insights in improving efficiency, dependability, and safety across a range of applications. They also highlight the adaptability and significance of optimizing gear pump performance in diverse industries.
Conclusion
The gear pump performance test revealed fundamental relationships between the pump's operation and its operating conditions. With the help of graphs such as discharge vs. head, discharge vs. input power, discharge vs. efficiency and discharge vs. NPSHr, we were able to gather crucial data regarding the power consumption, efficiency and likelihood of fluid bubbles forming in the pump.
We had the option to perceive what the test meant for release rates, power prerequisites, framework execution and NPSHr. This demonstrates that the most effective way to comprehend the siphon is to notice its conduct under a great many circumstances. Enterprises depend intensely on gear siphons. Understanding their activity works on the exhibition of liquid frameworks. Further trial and error under differing conditions is important to completely appreciate and improve gear siphon activity in down to earth applications.
References
- White F M. Fluid Mechanics. New York, NY: McGraw-Hill Education. 2011.
- Munson BR, et al. Fundamentals of fluid mechanics. Wiley Global Education, 2013.
- Fox, et al. Introduction to Fluid Mechanics. New York, NY: John Wiley and Sons. 2012.
- Merkus MP, et al. Quality of life in patients on chronic dialysis: Self-assessment 3 months after the start of treatment. American Journal of Kidney Diseases. Vol. 29, No. 4, 1997, pp. 584-592.
[Crossref] [Google Scholar] [PubMed]
- Locatelli F, et al. Anaemia in haemodialysis patients of five European countries: Association with morbidity and mortality in the Dialysis Outcomes and Practice Patterns Study (DOPPS). Nephrology Dialysis Transplantation. Vol. 19, No. 1, 2004, pp. 121-132.
[Crossref] [Google Scholar] [PubMed]
- Astor BC, et al. Kidney function and anemia as risk factors for coronary heart disease and mortality: The Atherosclerosis Risk in Communities (ARIC) Study. American Heart Journal. Vol. 151, No. 2, 2006, pp. 492-500.
[Crossref] [Google Scholar] [PubMed]
- Dhingra R, et al. Chronic kidney disease and the risk of heart failure in men. Circulation: Heart Failure. Vol. 4, No. 2, 2011, pp. 138-144.
[Crossref] [Google Scholar] [PubMed]
- Taddei S, et al. Hypertension, left ventricular hypertrophy and chronic kidney disease. Heart Failure Reviews. Vol. 16, 2011, pp. 615-620.
[Crossref] [Google Scholar] [PubMed]
- Morin DE, et al. Comparative study of proteins, peroxidase activity and N-acetyl-β-D-glucosaminidase activity in llama milk. Small Ruminant Research. Vol. 17, No. 3, 1995, pp. 255-261.
- Jenssen H and Hancock RE. Antimicrobial properties of lactoferrin. Biochimie. Vol. 91, No. 1, 2009, pp. 19-29.
[Crossref] [Google Scholar] [PubMed]
- Ueno H, et al. Randomized, doubleâ?blind, placebo-controlled trial of bovine lactoferrin in patients with chronic hepatitis C. Cancer Science. Vol. 97, No. 10, 2006, pp. 1105-1110.
[Crossref] [Google Scholar] [PubMed]
- Sano H, et al. Lactoferrin and surfactant protein A exhibit distinct binding specificity to F protein and differently modulate respiratory syncytial virus infection. European Journal of Immunology. Vol. 33, No. 10, 2003, pp. 2894-2902.
[Crossref] [Google Scholar] [PubMed]
- Gonzalez-Chavez SA, et al. Lactoferrin: Structure, function and applications. International Journal of Antimicrobial Agents. Vol. 33, No. 4, 2009, pp. 301-e1.
[Crossref] [Google Scholar] [PubMed]
- Bergelson JM, et al. Isolation of a common receptor for Coxsackie B viruses and adenoviruses 2 and 5. Science. Vol. 275, No. 5304, 1997, pp. 1320-1323.
[Crossref] [Google Scholar] [PubMed]

